By Don Urquhart, Times Chronicle
Temperature indicators for the Okanagan show a consistent shift to warmer average temperatures and more than double the number of extreme heat events than “normal” according to the Okanagan Basin Water Board (OBWB).
Every year since 2000 the temperature in the Okanagan has been warmer than normal according to the based on data stretching back to 1951, the water board said in its recently released annual report.
Temperature and precipitation indicators for the valley’s lower elevation are available from 1915 to 2023 with data from Environment and Climate Change Canada, from weather stations at the cities of Vernon at Coldstream Ranch, Kelowna, and Penticton.
As part of its focus on watershed health and water conservation and to answer frequently asked questions such as whether extreme weather events are becoming more common and whether the Okanagan is getting warmer, the OBWB developed over 30 climate change indicators through the 2023-2024 Climate Indicators Project.
Each year is compared to “normal” defined as the average from 1951 to 1980. The project allows people to explore how the Okanagan’s climate has shifted since 1915, when the first consistent measurements began.
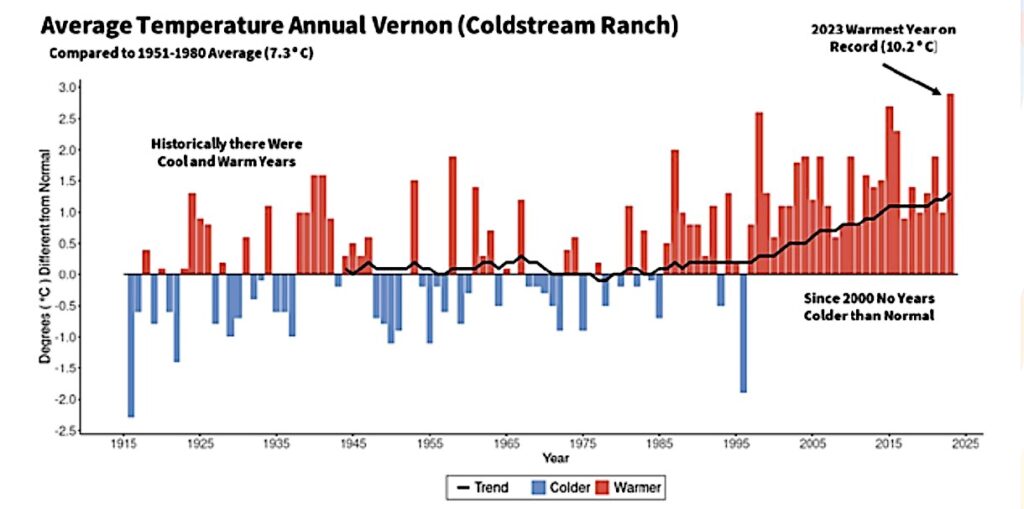
The average temperature is calculated by taking a rolling average of the preceding 30 years. OBWB graphic.
The OBWB also noted that 2023 was the hottest year on record at Vernon’s Coldstream Ranch. And since 2000, every year has been “warmer than normal.” In addition, the number of consecutive frost-free days has gone up by about two weeks, leading to longer growing seasons. However, as was seen in January 2024, cold snaps still occur in the valley.
Compared to the historical average of 1951-1980, mean daily temperatures have increased across the Okanagan, with a substantial shift occurring since 2000, the OBWB said. Compared to the baseline, the 30-year average for temperature is warmer by 1.3 °C in Vernon, 1.2 °C in Kelowna, and 0.8 °C in Penticton. No historical data over the same period was available for Oliver and Osoyoos.
And while precipitation trends are different for each city in the Okanagan, overall, recent years have been a bit drier, and there has been no significant change in the number of large single-day precipitation events, it said.
“With the warming temperature on the valley bottom, more precipitation falls as rain than snow, which leads to changes in how and when water moves through the watershed,” the OBWB added.
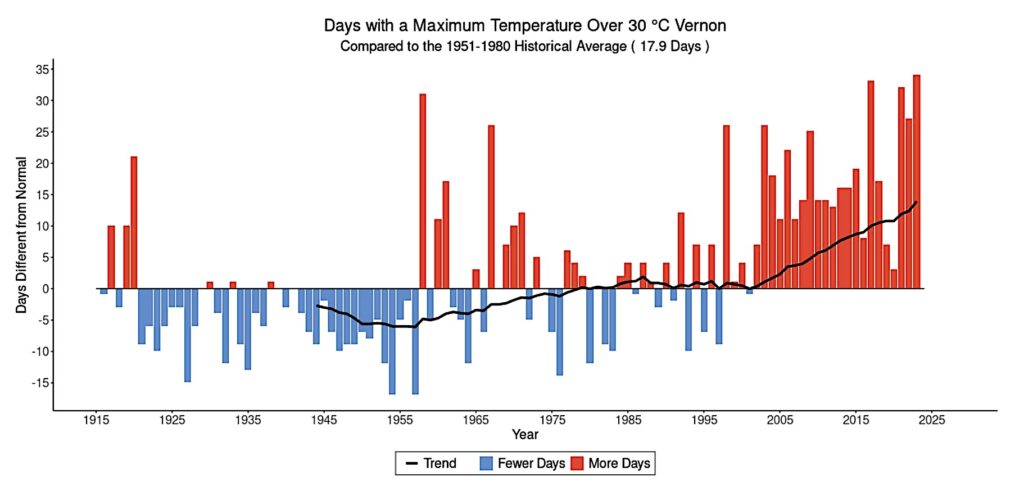
The number of days over 30 °C 1915 to 2023 In Vernon. Each year indicates if the total number of days was above or below the 1951-1980 historical average of 25.5 days. The line represents the 30-year rolling average for the preceding 30 years. OBWB graphic.
It went on to note that hydrology is related to more than just climate, and understanding the influence of climate change is challenging.
“Much of the OBWB’s work is related to helping the valley’s communities create resilience to handle extreme changes in water quantity, such as droughts or floods. It noted that a “clear pattern” has emerged in the hydrological indicators showing that spring melt and freshet are shifting earlier in the season, which has implications for how water is managed in the valley.
Since the 1970s, the OBWB has identified and addressed water-related issues throughout the Okanagan Basin. “The effects of climate change are becoming increasingly apparent through increased temperatures, changing precipitation patterns, changes in spring runoff events, increasing droughts, and the occurrence of other types of extreme events,” the OBWB says.
“The valley must take rapid and comprehensive action on adaptation and mitigation measures. To facilitate a sustainable and climate-resilient watershed, we need to know what changes have occurred, the pace of that change, and to systematically be able to track change moving forward.”
More information about the OBWB’s activities over the past year can be found in its annual report and information on the Okanagan Climate Indicators is available on its website.


